Data Analysis - Level 1
- Jun 1, 2023
- 2 min read
Analyzing the Data
There are two levels of analysis that are carried out when analyzing participant results, level 1 and level 2. The first level can be thought of as a preparation stage for individual data sets, while level 2 is where comparisons between participants take place.
Conducting Level 1 (GLM analysis)
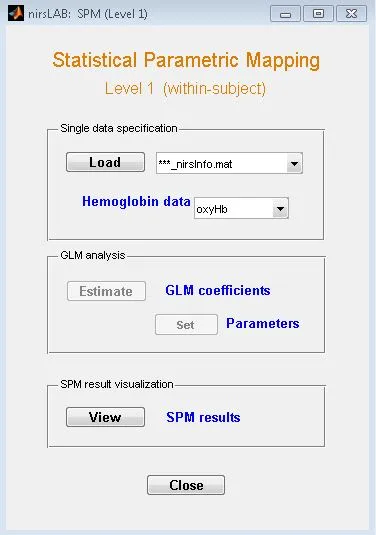
To begin level 1 analysis of an individual participant’s data, select “SPM” level 1 from the “Data Analysis” box.

This will open the “Statistical Parametric Mapping” window.

To begin GLM analysis, first select the desired hemoglobin data (oxyHb, DeoxyHb, or TotalHb) from the “Hemoglobin data” drop box. Each state will be analyzed individually, for this tutorial, oxyHb will be used as an example. Load in the oxyHb file by clicking:
[load]—[NIRS-date_subject number_nirsInfo]—[NIRS-date_subjectname_detector_OxyHb].
The pathway to access this file can be seen in image (Image: detector location). Once this file is selected, click “save”. At this point, a Help dialog box will appear notifying you that the file has been loaded. (Image: Help-loaded box).

Once the file is loaded, click “set parameters” in the “GLM analysis” box (shown above). This will open the “Parameter Set up for GLM Analysis” window. Whilst in this window, specify the basis function (number 2 in model specification). Select “hrf (with time and dispersion derivatives)”. Next, under number 3, select “nirsLAB condition file”. (Image: Parameter setup for GLM Analysis). With these specifications selected, click “confirm”.

This will prompt you to save the file. Be sure that the file is saved in the folder associated with the correct participant. Once the file is saved, A statistical analysis design will be generated.

This design shows the conditions of the test. In the image of a motor tapping test, the canonical, temporal, and dispersion (light to dark colors respectively, with the vertical axis representing time and horizontal axis representing event types).
After confirming that this statistical analysis image matches your conditions, click “Estimate GLM coefficients” in the “GLM analysis” box, this will generate a help dialog box notifying you that the estimated results have been saved, and shows you the location of the saved file. This help box is the end of the analysis process for oxyHb, repeat the above steps for deoxyHb and totalHb.


